
If you’re a founder, understanding your financial statements is non-negotiable. They provide a clear picture of your business’s health, help you make smarter decisions, and ensure you’re prepared to raise capital or meet compliance standards. Here’s what you need to know:
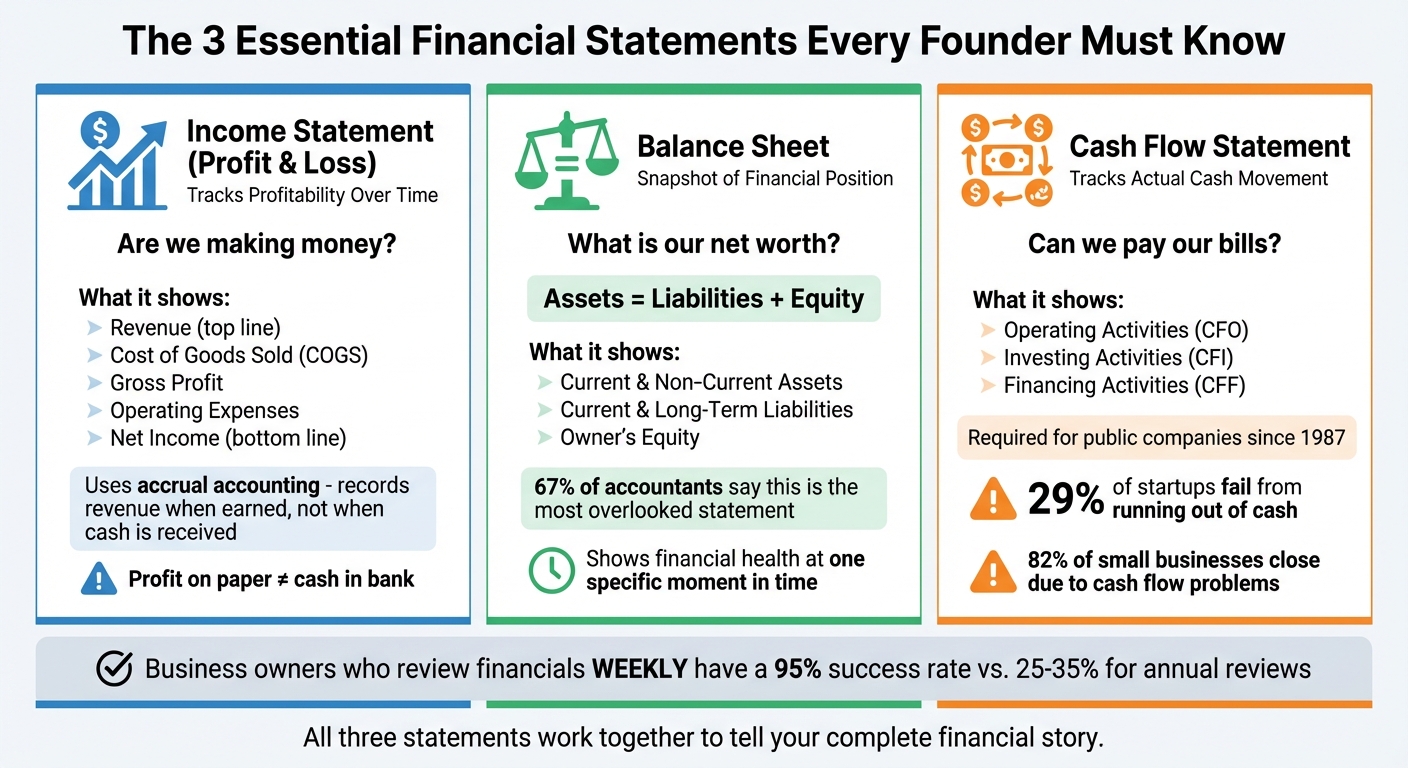
- Income Statement (Profit & Loss): Tracks profitability over time. Key question: Are we making money?
- Balance Sheet: Snapshot of assets, liabilities, and equity. Key question: What is our net worth?
- Cash Flow Statement: Tracks cash movement. Key question: Can we pay our bills?
Understanding the Balance Sheet
Think of your balance sheet as a snapshot of your business’s financial position at one specific moment. Unlike an income statement, which tracks performance over time, the balance sheet answers a straightforward question: What is our net worth right now?
At its core, the balance sheet relies on a simple equation: Assets = Liabilities + Equity. This equation ensures that everything your business owns (assets) is funded either through borrowed money (liabilities) or through investments and retained profits (equity). For example, if you purchase a $10,000 piece of equipment using a bank loan, your assets and liabilities both increase by $10,000.
"A strong balance sheet can tell you if a company has the muscle to survive a recession, fund its next big move, and pay back its shareholders." – Finzer
To see this in action, consider Apple’s fiscal year 2024 Q4 balance sheet, which reported total assets of $364.98 billion. While cash reserves slightly dipped from the previous year, non-current assets grew, and the balance sheet reconciled perfectly, showing how assets, liabilities, and equity align. This example highlights how a balance sheet provides a clear view of financial health at a given time.
Interestingly, 67% of accountants believe the balance sheet is often overlooked, despite its critical role in decision-making. Entrepreneurs who understand this financial statement gain valuable insight into risks, funding opportunities, and strategies for managing growth and debt.
Assets, Liabilities, and Equity Explained
Assets include everything your business owns that carries economic value. These are listed by liquidity, or how quickly they can be converted into cash.
- Current Assets: Cash, accounts receivable, inventory, and prepaid expenses, which can be converted within a year.
- Non-Current Assets: Long-term resources like property, equipment, patents, and trademarks that keep your business running.
Liabilities represent what your business owes to others. These are also categorized by due dates:
- Current Liabilities: Debts like accounts payable, short-term loans, wages, and unearned revenue, all due within a year.
- Long-Term Liabilities: Obligations like mortgages, bonds payable, and deferred taxes that extend beyond one year.
Misclassifying expenses can distort your financial picture. For instance, recording a $5,000 laptop purchase as an immediate expense instead of an asset to be depreciated over time skews your numbers.
Equity, also referred to as Owner’s or Shareholders’ Equity, is what’s left after subtracting liabilities from assets. It represents your company’s net worth and typically includes owner investments, paid-in capital, and retained earnings – profits reinvested into the business rather than distributed to shareholders.
| Component | Examples |
|---|---|
| Current Assets | Cash, Accounts Receivable, Inventory |
| Non-Current Assets | Equipment, Real Estate, Patents |
| Current Liabilities | Accounts Payable, Short-term Debt, Wages |
| Long-Term Liabilities | Bank Loans, Bonds Payable |
| Equity | Owner Investment, Retained Earnings |
For example, Walmart’s balance sheet as of January 31, 2025, showed $9 billion in cash and $56.4 billion in inventory. On the liability side, the company had $58.7 billion in accounts payable, while total shareholders’ equity stood at $97.4 billion. This resulted in a Debt-to-Equity ratio of 1.68, a key measure of financial risk.
With these elements in mind, you can start using the balance sheet to evaluate your business’s financial health.
Using the Balance Sheet to Measure Financial Health
The balance sheet’s real value lies in its ability to assess your company’s liquidity, solvency, and stability. Start by calculating the Current Ratio (Current Assets ÷ Current Liabilities). This ratio helps determine if your business can meet short-term obligations. A ratio between 1.2 and 2.0 is generally healthy, while anything below 1.0 could indicate trouble paying bills.
Another useful metric is the Quick Ratio [(Current Assets – Inventory) ÷ Current Liabilities], which excludes inventory to provide a clearer view of immediate liquidity. Additionally, the Debt-to-Equity Ratio (Total Liabilities ÷ Owner’s Equity) shows how much of your growth relies on debt versus investments. Higher ratios often signal greater financial risk.
To make the most of your balance sheet:
- Review it monthly to catch potential issues early.
- Compare balance sheets from different periods to spot trends. For instance, is your cash shrinking or are liabilities growing faster than assets? These insights can help you adjust your strategy.
Other key metrics include Working Capital (Current Assets – Current Liabilities), which highlights the funds available for daily operations. A negative or declining working capital figure could signal a looming cash crunch. Similarly, tracking retained earnings over time can show whether reinvested profits are driving growth.
Businesses with gross receipts or total assets exceeding $250,000 are typically required by the IRS to include a balance sheet in tax filings. Beyond compliance, pro forma balance sheets allow you to project the financial impact of major decisions, like taking on new loans or acquiring costly equipment, before committing.
Breaking Down the Income Statement
The income statement offers a dynamic view of a company’s performance over a specific period, unlike the balance sheet, which provides a snapshot of net worth at a single point in time. It uses accrual accounting, recording revenue when earned and expenses when incurred, giving a clearer picture of profitability.
"The income statement is your window into a company’s profitability. Unlike the balance sheet, which is a snapshot in time, the income statement tells a dynamic story of performance over a period." – Finzer
This distinction is crucial. A business might show a profit on paper but still face cash flow challenges if invoices remain unpaid. Recognizing this difference can help avoid confusing profitability with liquidity.
Revenue, Expenses, and Net Income
The income statement starts with revenue and deducts various expenses to calculate net income.
- Revenue: Often called the "top line", this is the total income from selling goods or services before any costs. For example, Microsoft reported $281.7 billion in total revenue for the fiscal year ending June 30, 2025.
- Cost of Goods Sold (COGS): These are direct costs like raw materials, production labor, and manufacturing overhead. Microsoft’s cost of revenue for the same period was $87.8 billion, leaving a gross margin of $193.9 billion.
- Gross Profit: Calculated as revenue minus COGS, this figure highlights product profitability and pricing efficiency.
- Operating Expenses (OpEx): These are indirect costs such as rent, salaries, marketing, R&D, and administrative expenses. Microsoft spent $32.5 billion on R&D, $25.7 billion on sales and marketing, and $7.2 billion on G&A during FY 2025.
- Operating Income (EBIT): This is the profit remaining after subtracting operating expenses from gross profit. It reflects the profitability of core business operations. Microsoft’s operating income reached $128.5 billion.
"Operating income (EBIT) is arguably the most important profit measure because it reflects core business earning power without the noise of capital structure decisions or tax planning." – Finwiz
- Net Income: Known as the "bottom line", this is the final profit after all expenses, interest, and taxes. Microsoft’s net income for FY 2025 was $88.1 billion, with a basic earnings per share (EPS) of $13.70 based on 7.433 billion outstanding shares.
| Component | What It Measures | Example (Microsoft FY 2025) |
|---|---|---|
| Revenue | Total income from sales | $281.7B |
| COGS | Direct production costs | $87.8B |
| Gross Profit | Revenue minus COGS | $193.9B |
| Operating Expenses | Indirect business costs | $65.4B |
| Operating Income | Gross profit minus OpEx | $128.5B |
| Net Income | Final profit after all costs | $88.1B |
How to Analyze Profitability
Profit margins are key to understanding how well your business converts revenue into profit at different stages.
- Gross Margin: This measures production efficiency and pricing power (Gross Profit ÷ Revenue × 100). Benchmarks vary by industry: SaaS companies aim for 70–90%, professional services target 50–70%, retail averages 30–50%, and manufacturing ranges from 25–40%. A declining gross margin may signal the need to adjust pricing or reduce production costs.
- Operating Margin: This reflects operational efficiency (Operating Income ÷ Revenue × 100). Healthy ranges include 15–25% for SaaS, 10–20% for professional services, and 5–10% for retail. A high gross margin but weak operating margin could indicate overspending on overhead or marketing.
- Net Profit Margin: This shows overall profitability (Net Income ÷ Revenue × 100). Small businesses often average 5–15%, while top-performing companies can reach 15–25%. Across G20 countries, the average corporate profit margin is about 8.5%. A strong operating margin but weak net margin might point to high debt or tax burdens.
"Revenue is vanity, profit is sanity." – Finzer
To dig deeper, consider vertical analysis, which expresses each line item as a percentage of revenue. This helps identify trends like margin compression or expansion and allows for easier comparisons with other companies. For example, Microsoft’s cost of revenue accounted for just over 30% of total sales in FY 2025.
Horizontal analysis compares dollar amounts across time periods to spot trends. For instance, if revenue grows by 10% but COGS increases by 20%, it indicates worsening unit economics despite a stable bottom line. Look out for operating leverage, where revenue grows faster than operating expenses, signaling a scalable business model.
Regularly reviewing your income statement – ideally monthly – helps catch issues like cost spikes or margin drops early. Compare results against your budget or forecasts, and flag any line item exceeding projections by more than 10%. Breaking down your P&L by product or service line can also reveal which offerings drive profit and which might need reevaluation.
This comprehensive understanding of profitability naturally leads into assessing liquidity through the cash flow statement. While a profitable income statement is a positive sign, it doesn’t guarantee cash in the bank due to timing differences in accounts receivable and payable. Up next: understanding how profit metrics connect to monitoring your cash position.
Cash Flow Statement Fundamentals
Continuing from our look at income statements and balance sheets, the Cash Flow Statement (CFS) zeroes in on how money actually moves in and out of a business. Unlike the income statement, which tracks revenue when it’s earned (even if payment hasn’t been received), the CFS focuses exclusively on cash transactions – recording events only when money changes hands. This distinction is critical for founders. A business might appear profitable on paper but still face cash shortages if payments are delayed. Since 1987, public companies have been required to issue cash flow statements to ensure greater transparency. This breakdown sets the stage for understanding the three key categories of cash flow that influence your company’s liquidity.
"Startups don’t die because they’re unprofitable on paper – they die because they run out of cash." – Maurina Venturelli, OpStart
The 3 Types of Cash Flows
A cash flow statement is divided into three essential categories:
- Cash Flow from Operating Activities (CFO):
This section captures cash generated or spent during regular business operations, such as customer payments, payroll, rent, and bills. It reveals whether your core operations are self-sustaining, even if your overall financials show a loss. - Cash Flow from Investing Activities (CFI):
This tracks cash used for long-term investments like equipment, technology, or other assets, as well as cash received from selling those assets. For startups, a negative cash flow here is common and often reflects reinvestment for future growth. - Cash Flow from Financing Activities (CFF):
This section records cash flows between your company and external financiers, such as venture capital funding, loans, debt repayments, and dividends. It shows how you’re financing operations and expansion efforts.
| Cash Flow Type | Typical Inflows | Typical Outflows |
|---|---|---|
| Operating (CFO) | Customer payments, subscription fees | Payroll, rent, marketing, vendor payments |
| Investing (CFI) | Sale of equipment, asset liquidation | Buying servers, R&D, purchasing property |
| Financing (CFF) | VC funding, bank loans, issuing stock | Debt repayment, dividends, stock buybacks |
For instance, Walmart reported a net cash decrease of $399 million for the fiscal year ending January 31, 2025. This was due to its investments and financing outflows surpassing the cash generated from operations. Even large, profitable businesses can experience negative cash flow when they make significant investments or return capital to shareholders.
Tracking Cash Flow for Startups
For startups, where every dollar matters, understanding these cash flow categories is critical. Early-stage startups often show negative operating cash flow as they focus on growth rather than immediate profitability. To manage this, calculate your net burn rate by subtracting monthly cash revenue from monthly cash expenses. For example, if you’re spending $120,000 monthly but only bringing in $40,000, your net burn rate is $80,000. With $800,000 in the bank, you’d have about 10 months of runway.
Investors typically expect startups to maintain 12–18 months of runway after securing funding. A rolling 13-week cash forecast can help you anticipate shortages, plan major expenses, adjust hiring, and avoid financial surprises.
"Profit might be the goal, but cash is the oxygen." – Maurina Venturelli, OpStart
Stay alert for warning signs. If your net income is growing but operating cash flow stays negative, it could mean that revenue is being recorded on paper long before payments are received. Likewise, large shifts in accounts receivable or payable can strain your liquidity, even if your business looks profitable.
To stay ahead, review your cash flow statement every month to spot trends early. Calculating free cash flow – by subtracting capital expenditures from net operating cash flow – can help you understand how much cash is available for reinvestment or shareholder returns. By monitoring these patterns, you’ll be better equipped to decide when to scale, cut costs, or secure additional funding.
Key Financial Metrics Every Founder Should Know
Once you’re comfortable with your three core financial statements, the next step is to monitor key metrics that give you a clear picture of your business’s health. These metrics build on the insights from your financial reports, helping you make smarter decisions, address issues early, and keep investors informed. In fact, business owners who review financial reports weekly are far more successful – 95% compared to just 25–35% for those who only check them annually.
These essential metrics fall into three main categories: profit margins (efficiency), burn rate and runway (survival), and revenue growth vs. operating expenses (scalability). Let’s dive into profit margins first, as they highlight the profitability of your business at various levels.
Profit Margins: Gross, Operating, and Net
Profit margins help you understand different aspects of your profitability. Building on what you learned from the income statement, gross profit margin reflects production efficiency, operating profit margin measures the viability of your business model, and net profit margin shows overall profitability after all costs.
| Margin Type | Formula | What It Reveals |
|---|---|---|
| Gross Profit Margin | (Revenue – COGS) / Revenue × 100 | Is your product profitable? |
| Operating Profit Margin | (Operating Income / Revenue) × 100 | Is your business model profitable? |
| Net Profit Margin | (Net Income / Revenue) × 100 | What’s your actual profitability? |
Tracking these margins monthly can help you catch issues early. For example, a high gross margin but a low operating margin might indicate "operational bloat", meaning your overhead costs are too high. Always compare your margins to industry-specific benchmarks – never across unrelated sectors.
To ensure accurate numbers, treat owner compensation as an operating expense rather than a draw from profits. Additionally, even small pricing adjustments can have a big impact – a 1% price increase, if sales volume stays steady, can lead to a 5% jump in total profit margin.
Profit margins give you a snapshot of profitability, but managing cash flow and survival comes down to understanding your burn rate and runway.
Burn Rate and Runway
Your burn rate measures how quickly you’re spending cash, while your runway tells you how long you can keep going at that pace. These metrics act as a survival timer. Burn rate comes in two forms: gross burn (total spending per month) and net burn (spending minus revenue). Net burn gives a clearer picture of how fast your cash reserves are shrinking.
For example, if you’re spending $150,000 a month but bringing in $50,000 in revenue, your net burn is $100,000. With $1.2 million in the bank, your runway is 12 months ($1.2M ÷ $100K). This matters because 29% of startups fail from running out of cash, and 82% of small businesses close due to cash flow problems, even if they’re technically profitable.
Startups with at least 12 months of runway are 3.5 times more likely to survive than those with less than 6 months. Plus, startups raising funds with less than 6 months of runway often accept valuations 35–50% lower than those with more breathing room. To maintain leverage, aim to start fundraising with at least 10 months of runway remaining.
In today’s fundraising landscape, with longer timelines (6–9 months instead of 3–4), startups are targeting 24–36 months of runway instead of the previous 18 months. Investors are also looking at the burn multiple (net burn divided by net new Annual Recurring Revenue) to assess growth efficiency. A burn multiple below 1× is excellent, while anything above 3× raises concerns. For context, Series A SaaS companies typically have a burn multiple of around 1.6×.
To smooth out seasonal fluctuations, calculate your burn rate using a 3-month rolling average. Additionally, maintaining a 13-week rolling cash forecast helps you anticipate shortfalls 4–6 weeks ahead.
While burn rate and runway focus on survival, the balance between revenue growth and operating expenses determines how sustainably you can scale.
Revenue Growth and Operating Expenses
Monitoring revenue growth alongside operating expenses is crucial. If expenses rise faster than revenue, you’re heading toward a cash crisis. Bottom-up forecasting – using inputs like leads, conversion rates, and churn rates – is the most reliable way to project revenue, rather than relying on broad market-share assumptions.
Track operating expenses as a percentage of revenue rather than just in dollar amounts. Since headcount accounts for 60–75% of a startup’s total burn rate, hiring decisions are critical. A good rule of thumb is to hire "one step behind" – wait until the absence of a role creates measurable strain before filling it. This avoids overstaffing, which is difficult to reverse quickly.
Another common expense drain is software subscriptions. Startups often waste around 30% of their SaaS budget on unused tools. Conduct quarterly audits to cut unnecessary subscriptions, which can add $10,000–$30,000 to your monthly burn. Eliminate tools without active owners or measurable value to trim the 5–10% of burn typically spent on SaaS.
Tie spending to revenue-based milestones (e.g., hiring a sales rep when Monthly Recurring Revenue hits $50,000) instead of time-based goals. This ensures you’re scaling costs in line with actual performance, not just projections. You can also optimize working capital by negotiating payment terms – offer customers 10–15% discounts for upfront annual payments while requesting 30–60-day terms from vendors.
Finally, distinguish between fixed costs (e.g., rent, salaries) and variable costs (e.g., commissions, usage-based software). Fixed costs remain constant regardless of performance, while variable costs scale with revenue. Minimizing fixed costs early on reduces the time needed to reach cash flow breakeven and makes your business more resilient to revenue dips.
sbb-itb-ba0a4be
Using Financial Statements to Make Better Decisions
Once you understand financial statements, the next step is using them to predict outcomes and guide your decisions. What sets thriving founders apart from those who struggle isn’t just knowledge – it’s the ability to transform raw data into meaningful insights and systems.
Start by combining scenario planning with regular monitoring. Build three financial models: a Base case (your best estimate), a Bear case (30–40% revenue shortfall), and a Bull case (20–30% revenue increase). These models help you assess the impact of decisions before committing resources. For instance, if you’re thinking about hiring a new sales rep, test the decision using your Bear case to ensure you can still afford the hire even if revenue falls short.
Make sure your financial statements are interconnected. This way, any changes in assumptions will automatically update across all reports, minimizing errors. For example, if customer payments are delayed, it could drain your cash reserves even if your income statement shows strong net income.
Building a Simple Financial Model
You don’t need fancy software to create a solid financial model. Most investors prefer tools like Google Sheets or Excel because they’re straightforward to review. Build your model from the ground up, focusing on real business drivers rather than lofty market share assumptions. Instead of saying, "We’ll capture 2% of a $500 million market", break it down into specifics like the number of sales reps, their quotas, average contract values, and conversion rates.
"Revenue will influence the rest of the profit and loss (P&L) assumptions. So if revenue estimates are materially misstated, the company risks overstaffing or understaffing."
– Tiffany Hovland, CPA and VP, Growth Operators
Since headcount makes up 60–75% of startup expenses, it’s critical to model it accurately. Plan for loaded costs (1.2–1.3× base salary) and account for hiring lead times – budget 4–6 weeks to fill a role and additional time for new hires to ramp up. Keep your assumptions separate so you can quickly adjust your model when testing different scenarios.
For the first two years, keep your model detailed with monthly data. Switch to quarterly projections in the third year. Track cash collected and revenue recognized separately – this is especially important for SaaS companies with annual upfront contracts, where cash flow might look strong even if revenue performance is weaker. Set your model to calculate key metrics like the burn multiple (net burn divided by net new ARR, aiming for under 1.5×) and the Rule of 40 (revenue growth rate plus EBITDA margin should equal 40% or more).
Making Data-Driven Decisions
Once your model reflects the real drivers of your business, use it to evaluate opportunities and monitor performance. Always analyze all three financial statements together. For example, if accounts receivable grows faster than revenue, it could signal collection problems even if profits look good. Set a review schedule: check cash balances and forecasts weekly, compare the income statement to your budget monthly (investigating variances over 10%), and review key ratios quarterly.
Watch out for warning signs that demand immediate attention. A steady decline in gross margin could mean you’re losing pricing power or facing higher costs. If your current ratio (current assets divided by current liabilities) drops below 1.5, it might indicate trouble covering short-term obligations. Use DuPont analysis to break down return on equity into profit margin, asset efficiency, and financial leverage – helping you understand whether strong returns come from operational success or increased financial risk.
Keep a 13-week rolling cash forecast to spot potential shortfalls 4–6 weeks ahead, giving you time to adjust spending before problems escalate. When exploring new opportunities, like entering a new market or launching a product, test them against your Bear case. Calculate the payback period (customer acquisition cost divided by monthly revenue per customer, multiplied by gross margin), aiming for under 12–18 months. Also, monitor your LTV:CAC ratio, targeting at least 3:1 for sustainable growth.
"No model is ever 100% accurate, but some are more useful than others."
– Ethan Lu, Partner, Phoenix Strategy Group
The most successful founders aren’t the ones with the fanciest models – they’re the ones who consistently use their financial data to challenge assumptions, spot problems early, and balance growth with sustainability. This approach not only drives smarter decisions but also sets the stage for adopting advanced tools to streamline financial management.
Tools and Services for Financial Management
Understanding your financial statements is just the beginning – you also need the right tools to ensure your books stay accurate and up-to-date. These tools turn insights from your financial data into actionable, real-time information. The best part? Modern accounting tools have made bookkeeping much easier than it was even a few years ago. You don’t need to be a CPA to maintain clean records, but selecting the right software and services is essential, depending on your business’s stage and complexity.
Tools to Simplify Accounting
The best systems combine automation with human expertise. Many full-service finance providers pair automated platforms with experienced CPAs and former CFOs to handle bookkeeping, taxes, and strategic planning. This approach is ideal for founders who want real-time financial data without spending hours categorizing transactions. AI-powered tools take it a step further by integrating directly with banking, payroll, and expense management systems, automatically categorizing transactions and reconciling books in real time. These platforms boast over 90% accuracy, significantly reducing the time spent correcting errors.
When selecting accounting tools, focus on cloud-based solutions that integrate seamlessly with other systems. Your software should connect effortlessly with banking, payroll, and expense platforms to ensure smooth data flow. As your business grows, transitioning from cash-basis to accrual-basis accounting becomes necessary – choose a platform that supports this shift without requiring a full migration to a new system. Additionally, look for real-time dashboards that provide daily updates on key metrics like burn rate, runway, and cash position, so you’re not stuck waiting for month-end reports. Automating bookkeeping can save 15 to 20 hours per month, and neglecting it can cost startups between $5,000 and $15,000 in cleanup fees. By streamlining these processes, you’ll be better positioned to work with experts who can handle more advanced compliance and reporting needs.
BusinessAnywhere‘s Accounting and Compliance Services

For founders who prefer to focus on scaling their business instead of managing spreadsheets, outsourcing to professional services is a smart move. BusinessAnywhere provides comprehensive bookkeeping services that capture all transactions – sales, expenses, and payments – laying the groundwork for accurate financial reporting and strategic planning. These services, combined with automated tools, transform raw financial data into actionable insights. This is especially critical when preparing for fundraising, as professional firms typically uncover an average of $47,000 in errors when taking over a client’s books for the first time. Mistakes in financial statements can lead to 15–20% higher audit fees and raise red flags during due diligence, potentially delaying or jeopardizing funding.
BusinessAnywhere also specializes in tax compliance, offering services like S-Corp tax filings ($97) and US LLC tax filing services ($700) to ensure accurate payments and avoid penalties. With 38% of startups failing due to cash flow issues and 82% of small businesses citing poor cash flow management as a major factor, maintaining disciplined month-end financial closes is essential. Professional services can help enforce this discipline, delivering investor-ready financials within 5–10 business days. This allows you to focus on driving growth while maintaining the financial rigor needed to succeed.
Conclusion
Your financial statements tell the story of your startup’s journey – from earning revenue to managing cash flow – and help you navigate potential financial challenges. The Income Statement, Balance Sheet, and Cash Flow Statement work together to provide a full picture: profitability, net worth, and actual cash movement. Grasping how these pieces fit together can be the difference between scaling your business and running out of resources.
It’s important to remember that showing a profit on paper doesn’t always mean you have cash in the bank. A quarter might look profitable on your income statement, but without cash to cover expenses, your business could still face trouble. Here’s a striking fact: business owners who review their financial reports weekly have a 95% success rate, compared to just 25–35% for those who check them only once a year. Setting aside just 30 minutes each month to review all three core financial statements can help you spot and address issues before they escalate.
Investors aren’t just betting on your idea – they’re betting on how well you understand your financials. Clear and accurate financial statements demonstrate that you’re organized, responsible, and thinking like a CEO. By mastering these numbers, you position yourself to take advantage of modern financial tools.
Today, managing finances is easier than ever thanks to tools and services designed to simplify the process. Whether you’re using automated software or outsourcing to services like BusinessAnywhere’s bookkeeping and tax filing, the key is having a system that keeps your records accurate and ready for audits in real time. This allows you to focus on what you do best: growing your business.
Make it a priority this month to schedule your first 30-minute review session. Track your burn rate, monitor your margins, and always be ready to answer three critical questions: Are we making money? What is our net worth? Can we pay our bills? By mastering these basics, you’ll gain the financial clarity needed to make smart, data-driven decisions that help your business thrive.
FAQs
How do the income statement, balance sheet, and cash flow statement connect?
The income statement, balance sheet, and cash flow statement work together to give a complete view of a business’s financial well-being.
The balance sheet provides a snapshot of the company’s assets, liabilities, and equity at a specific moment. In contrast, the income statement focuses on performance over a time period, detailing revenue, expenses, and profit. The cash flow statement ties these two together by illustrating how cash moves in and out of the business, clarifying changes in cash and how they connect to profitability and overall financial standing.
Why can my startup show profit but still be low on cash?
Your startup might look profitable on paper, thanks to the income statement, but still struggle with cash on hand. Why? Profits often include non-cash items like depreciation or revenue that hasn’t been collected yet. On the other hand, cash flow shows the real movement of cash in and out of your business. Delayed payments from customers or hefty operating expenses can tighten your cash flow, even if profits seem healthy. Keeping a close eye on cash flow is crucial for maintaining your business’s financial stability.
What numbers should I review every week to avoid running out of runway?
Monitoring your cash burn rate and cash runway on a weekly basis is crucial to keeping your business financially stable. The burn rate shows how fast your company is spending money, while the runway tells you how many months of cash you have left. By keeping a close eye on these numbers, you can better understand your financial position and make smarter decisions to avoid running out of resources.